Dear Friends,
I ran SDR for a smaller watershed using InVEST 3.7.0. I am getting some errors/warnings while running the model. Somehow I am getting the output with all necessary intermediate files, but the issues are;
Appearance of No Data pixels in the stream TIF and subsequently in other output files.
The sediment export (ranging from 0 to 37017) and Retention values (ranging from (negative value) - 304 to 110523) are very much higher.
The model always produces NoData pixels in the stream network. This is because the model does not do any in-stream processing, so as it moves sediment down slope, it stops calculations when the sediment reaches the stream.
Values for sediment export may be very high, especially in very high-slope areas. And larger pixels are likely to have larger values, since the results are tons/year/pixel. Look around to see if these high values are very typical, or just a few pixels have these values - it’s likely that most pixels will have much lower values. Also look at the values for the input layers. Sometimes rainfall erosivity can have very high values that cause high sed_export results. The values for soil erodibility can be confusing, since they are often given in US units, and if they are, they need to be converted to metric by multiplying by 0.1317, which will reduce the sed_export values.
Remember that sediment retention is an index, relative to bare ground, it’s not an actual quantity of sediment retained. Although it really shouldn’t have negative values, that sounds like a bug in the model.
I have resolved one issue completely and another one partially.
Regarding the appearance of No Data Pixel boxes, I have made some necessary modification (i.e. removed unnecessary fields) in the watershed attribute table.
Now comes the second issue: As you have mentioned in your reply, earlier I have used Soil Erodibility value in US units and now I have converted them in to metric. After I ran the model and now Sediment export values ranges from 0 to 4993 tons/pixel (30x30 m size) in the same basin. Still it is higher, I guess. But almost 99 percent of the pixels are well within the range of 0-100 tons/pixel (Map attached:[Uploading: Sediment Export Map_for Forum.jpg…]. I don’t have any clue on handling these outlier values.
For your information, the Sediment Retention value ranging from -40 to 14555 (negative) tons/pixel.
I’m not sure what to say about the outlier values. It is a common thing to happen, usually in places with very steep topography. In some ways this is a problem with the USLE equation that’s used - it was made for places with low slopes, and does not perform as well with high slopes.
If there are just a few with these high values, you can look at the histogram and symbolize on the 99 percent of the range so the others don’t skew the symbology.
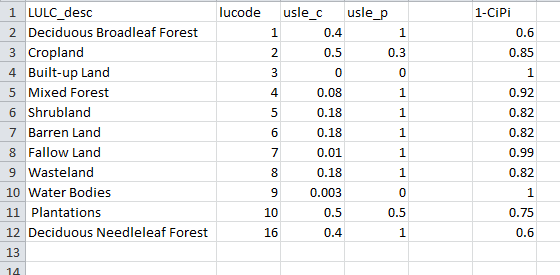
Regarding the negative values for sediment retention, from the User Guide, the equation that’s used is Ri ⋅ Ki ⋅ LSi (1−CiPi) × SDRi. Is it possible that you have one or two values for usle_c and usle_p that would cause the (1−CiPi) part to have a negative value?
Hi @swolny -
Thanks again. The pixels of high sediment export values are belongs to very steep topography area, indeed.
I have checked the (1−CiPi) value in biophysical table, but it is giving positive values |560x275.
I want to clarify one thing is that, only Sediment retention value is in negative to positive range, whereas Sediment Retention Index is in the range of 0 to 15206 .
That’s good to hear that the sediment retention index does not have negative values.
@Rich, it would be interesting to know the difference between how sed_retention.tif and sed_retention_index.tif are calculated, and confirm that sed_retention_index.tif is the layer that should be used if people want to get a relative idea of how current vegetation is reducing erosion.
@Kantharajan, if you want a more robust way of calculating retention (that’s not just an index), if you have future scenarios you can take the difference in sed_export between the current and future scenario and have a quantitative measure of how the future scenario changes the amount of sediment that ends up in streams. With the reminder that we can’t trust the specific quantitative results of models until they’ve been calibrated.
@swolny, I have one more query to clarify. I am using Soil Erosivity data of European Soil Data Centre with 30 arc second resolution with the temporal coverage of 30-40 years, predominant in the last decade: 2000 – 2010; Soil Erodibility data, derived from the Harmonized World Soil Database (2012).
Is it possible to use the above mentioned datasets for assessing Sediment Retention/Sediment Export of particular river basin under different LULC scenarios of Past (2004), Present (2014) and future (2024)?
Is this the Soil Erodibility in Europe data layer (link here)? If so, it seems like a fine layer to use, although they don’t mention having several time periods, and I’d be very surprised if they do have multiple time periods for soil data, I’ve never seen that before (but this might be a first!)
If you do have soil erodibility (or rainfall erosivity) data from multiple time periods, you can of course use them for scenarios. One thing to keep in mind is that it’s also optimal to have a land use/land cover map from around that same time period, but that’s not always possible.
Hi @swolny
I am using Soil Erosivity data of European Soil Data Centre (Link here) and Soil Erodibility Data of Harmonized World Soil Database (Link here).
As you mentioned correctly, getting contemporary LULC data wrt other input datasets are very difficult. My curiosity is to know, if we have access to LULC data sets of different years (i.e. Decadal LULC map 1990/2000/2010), up to what extent it can be better used with the above-mentioned data sets to assess the past, present and future scenarios of Sediment retention services.
The difference between sed_retention.tif and sed_retention_index.tif is the following:
sed_retention.tif: Difference in exported sediments on basic and bare watershed, essentially RKLS * SDR_bare - USLE * SDR
sed_retention_index.tif: Is (RKLS-USLE)*SDR/SDR_MAX.
My recollection is that the latter was added after the SDR model was originally released and was an attempt to get a better valuation of the retentative capacity at a per-pixel element. Since that time we’ve developed a true “sediment deposition” layer that calculates where soil is retained that is otherwise washed off before it reaches downstream. That’ll be released in the next major version of InVEST. I otherwise can’t recommend one over the other, but at least you know what they do!
 .
.