I’m using the InVEST Seasonal Water Yield model and would like to use the qb output from the aggregated results shapefile to quantify the supply of the water yield ecosystem service.
According to the documentation, the values are in mm, but they are meant to be interpreted as relative indicators, not absolute quantities. However, in my results, ‘qb’ values range from −77 to +36 mm across multiple watersheds.
I’m wondering:
Is it normal to get negative ‘qb’ values?
Could this indicate a problem in my input data or model setup?
Or is it acceptable, given that ‘qb’ is meant to reflect relative spatial patterns rather than physical quantities?
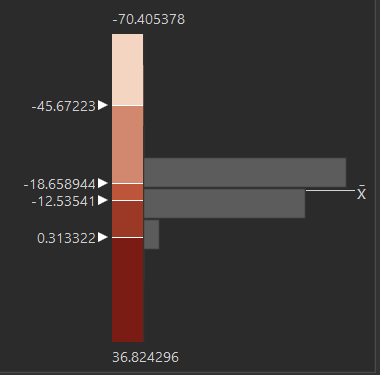
To better understand the distribution, I’ve included below a histogram of ‘qb’ values across all watersheds in my study area. Any advice or clarification from others who have used ‘qb’ in watershed-level analysis would be greatly appreciated!
Thanks for the reply, I hadn’t seen this thread. From what I understand reading this issue, this is a bug for which no solution has been found currently. Can you confirm that this is right, please?
Your answer will help me adjust my methods moving forward and try to find a workaround or another approach to estimate the water supply in my study area. Right now, I’m thinking of potentially transferring from seasonal water yield to annual water yield if both models can be use to estimate drinking water consumption…
Yes, we believe this is being caused by a bug which was first identified in this forum thread. We have not had an opportunity to prioritize squashing this one yet, but thanks for your patience and for reminding us that it’s a problem for users like yourself.
I’m personally not very familiar with the InVEST Annual Water Yield (AWY) model, but I know that it’s aimed at helping to model nature’s contributions to hydropower production. It does provide spatial water yield results, but only as annual averages. As mentioned in the User Guide, AWY
…is based on annual averages, which neglect extremes and do not consider the temporal dimensions of water supply and hydropower production.
To your original question about negative values for qb, that is a valid result. This issue shared above applies to B_sum, which should not have negative values. qb, on the other hand, can be positive or negative. (The seasonal water yield model provides two different approaches to quantifying contributions to baseflow which is confusing. We’re working to clarify that in the User’s Guide. For now, the Introduction section outlines the two approaches. qb is an indicator for the first approach mentioned, more akin to potential baseflow; and B_sum is an indicator for the second approach.)
A negative value for qb indicates that the model is estimating that the catchment is losing more water to evapotranspiration and quickflow than it is getting in precipitation. If you are modeling a current/observed scenario, that seems unlikely to be sustainable in the long term and makes me think either the model isn’t well calibrated (so treating these all as relative values, as the User’s Guide suggests, is extra advisable) or the catchment delineation isn’t complete, so there are water inputs not being accounted for.
The annual water yield model could be a good alternative if the total amount of water available over the course of a year is a good indicator for the ecosystem service you are interested in. That may be the case if there is water storage, such as a reservoir. If water is scarce during certain parts of the year and abundant during other times, such that only increases in water availability during the dry season provide a benefit, then the seasonal water yield model would be a better fit. In both cases, we’d recommend interpreting the results as relative, unless the model has been calibrated to local observed data.
I hope that helps clarify a bit, and I’d be interested in hearing back how you decide to proceed!
Hello @Lisa, thank you very much for this detailed answer - it’s really clear and helpful. I had noticed in the input guide that the vri_sum could be positive or negative, but what got me confused is that this wasn’t specified for qb. I’ll look at my data inputs to confirm if there’s something wrong with the catchment delineation or the precipitation and evapotranspiration data.
Since I’m working with relative values in my project, having precise absolute values isn’t really essential for me. However, I’d like to make sure the average trends are correct. According to the current distribution of my data, the model estimated that my entire study area loses more water than it receives in precipitation, which seems surprising.
If it still doesn’t work, I’ll switch to annual water yield, since I’ve already managed to get it to work in the past and that it produced outputs that seemed realistic to me. I originally made the switch from AWY to SWY because your documentation indicates that this model is more for addressing hydroelectric production while I am interested in water availability for residential consumption.