Hi!
As the title says, my sediment export output raster displays a weird stairs pattern across the landscape (SDR.jpg). Like the sediments are not flowing smoothly on the slopes. Same thing with the other model outputs, but the effect is less pronounced. I don’t get this outcome with the NDR model outputs (NDR.jpg), they flow smoothly (which is what made me question), yet I use the same DEM in both models!
Thanks for the post and welcome to the forums. What version of InVEST are you running?
It ultimately might be easiest to look into this issue if you could share your data so we can reproduce what you’re seeing on our end. Would it be possible to zip up your inputs and share them here or in an email ( ddenu @ stanford . edu )? If they’re larger inputs a shared Google Drive link or other cloud service sharing option works well.
I was wondering if you found anything related to my question? Is the link working? I can try to send you the data somewhere else if the google drive link doesn’t work!
Thanks for the feedback. I tried the latest version of Invest and I confirm the issue is still there. It’s weird, like it’s skipping constant elevation intervals. I hope we’ll solve this!
Thanks again for the help, tell me if you need something else,
Could you post your logfile run with the latest version of InVEST that is generated with each model run? Can you also say what the Threshold and other parameter values were that you used?
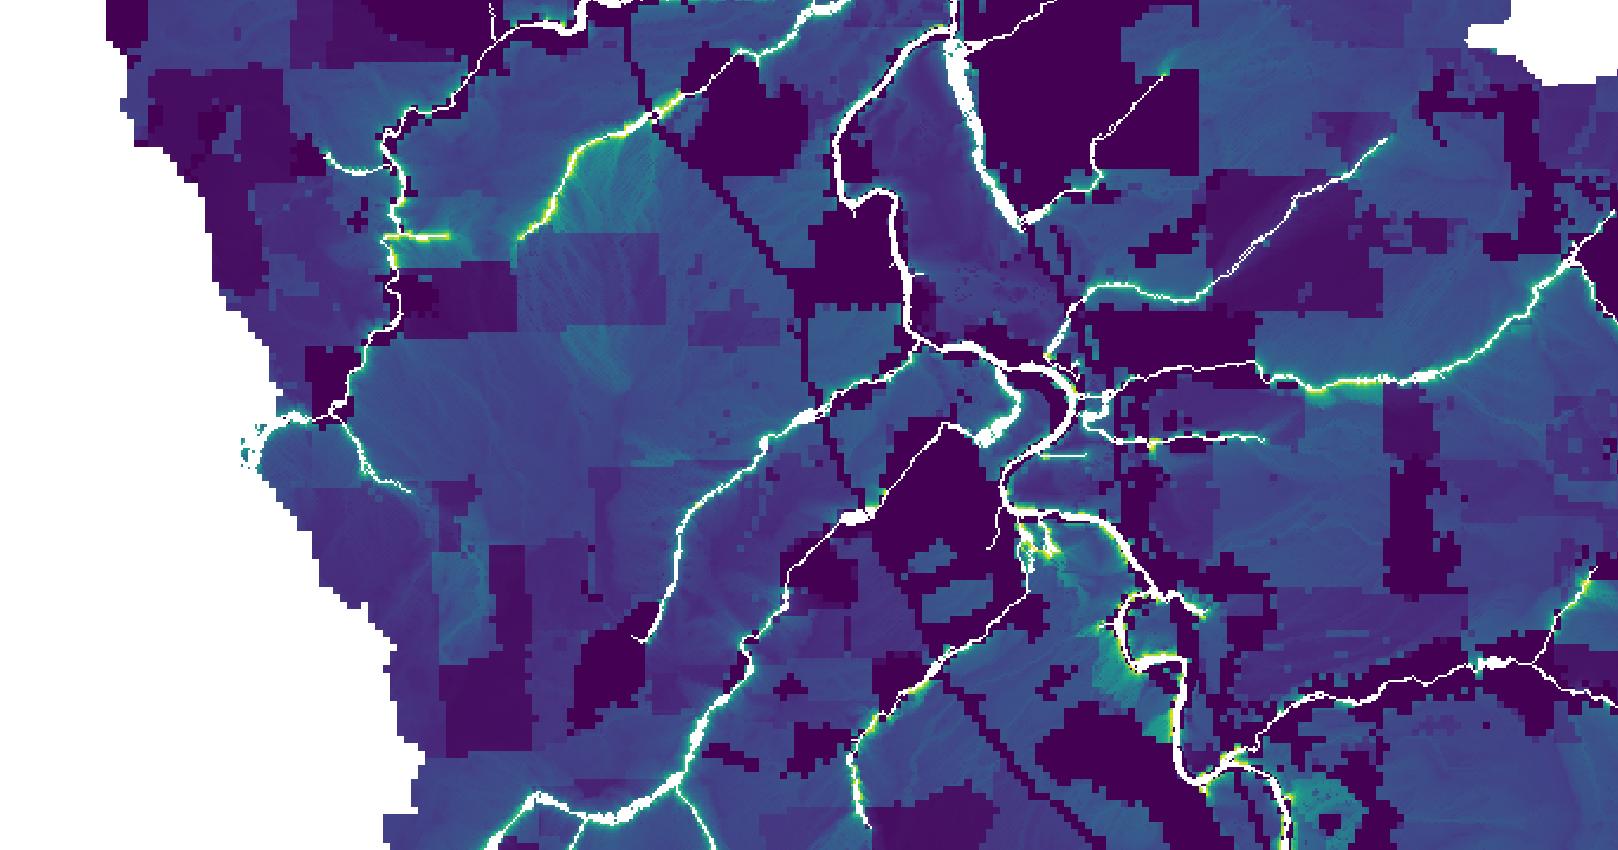
I wasn’t able to reproduce outputs that look like the images you posted using your data. Did you do some editing in GIS to really make those outputs “pop”? I’m seeing values from 0 to 25 in sed_export. I’ve attached the results I’m getting. Let me know what you think.
I see the exact same effect in the results you’re getting. And I just use a different color ramp to enhence the “stairs” effect, but it’s visible in black&white also. I didn’t edit the output.
It wouldn’t have me thinking if I didn’t get the smooth flowing results in NDR. Because I suspect now that the sediment quantities may not be accurate if the flow/transportation is disrupted ou irregular.
What do you see when you display the sed_export raster in a GIS software? Can you post an image? And do you think there could be an issue regarding the total sediment export?
Here’s what I see in black and white continuous 0 - 25 sed export values. There are a lot of very small values driving everything to color black. If you look around in the intermediate output folder you’ll see flow_accumulation.tif, slope.tif, and other useful rasters. Both those look okay to me.
If you’d like to share your NDR inputs as well, I can compare the lower level operations such as DEM pit filling, flow accumulation, etc. are the same between the two.
I looked into the intermediate outputs and the rasters you mentioned look the same.
Here are my inputs for the NDR model:
Other parameters:
Treshold flow acc: 1200
K parameter: 2
Sub critical length (N): 10
Sub critical length §: 10
Sub max retention eff. (N): 0.8
Sub max retention eff. (N): 0.8
If the results look okay to you, I’ll consider the stairs effect in SDR not a modeling problem!
I looked into the intermediate outputs and the rasters you mentioned look the same.
Here are my inputs for the NDR model:
Other parameters:
Treshold flow acc: 1200
K parameter: 2
Sub critical length (N): 10
Sub critical length (P ): 10
Sub max retention eff. (N): 0.8
Sub max retention eff. (P ): 0.8
So the most probable reason for results looking stepped in the SDR’s sed_export.tif but not the NDR n_export.tif is that SDR’s calculations include USLE, a calculation that is dependent on the on-pixel slope. NDR does not use USLE. Outside of that, both models have similar approaches to how the upstream areas of a pixel (including upstream slopes) are considered.
What’s interesting about this particular case is that your DEM is stepped. Pixel values in your DEM are all integers, and so because of the relatively fine resolution of the dataset, we end up with long, narrow plateaus that then have a higher slope at the edges of the steps, and so the slope calculations (and, ultimately, USLE) are higher at the edges of the steps and all of this results in this sort of stepped effect in the output. Neither SDR nor NDR does any interpolation, but I suspect that if you were to smooth out your DEM, you’ll see a reduction in this stepping of outputs in the sed_export.tif output.
One other thing worth noting is that although this stepped effect is present, I’m only seeing it in sed_export.tif when I force the color range in QGIS to weight towards the lower end of the pixel value spectrum (for future us, I used QGIS’s pseudocolor, Quantile color mode), and the absolute difference in pixel values across the steps are pretty small relative to some of the other pixel values elsewhere in the raster.
So all of that is just to say that the steps seem like a reasonable consequence of SDR’s usage of USLE given that your DEM has integer values (and thus lots of small, narrow plateaus) and so smoothing out your DEM should avoid this stepped appearance in SDR outputs.
I’m so sorry I realised I never responded to your answer back in november. Yes, you pinpointed the problem, my DEM pixels values were all integers. I corrected the problem since.