SDR New Version 3.12 takes too long to run pit_filled_dem

What is the issue or question you have?

I am running the new version of SDR (Version 3.12). It’s taking too long (days) to finish the pit_filled_dem raster.
I am getting the following type of info: “pygeoprocessing.routing.routing INFO (fill pits): 1849600 of 73990120 pixels complete”

What do you expect to happen?

I would like to know if I should wait for this run to finish or if I can be sure that it will give me an error / wrong results.

What have you tried so far?

I tried once with a DEM without fill sinks correction, which was really fast and got me all the results. Although, I thought the results were weird concerning avoided erosion and sediment export. Too many 0 or low values and I am unable to visualize a spatial difference unless I classify the raster by 10 quartiles.
I am now trying a new run with the corrected DEM (fill sinks) but, as I said, it’s taking days.
I would like to know if the first results are probably corrected or not. Also, I would like to know if it’s normal to take this long to run with a corrected DEM.

Attach the logfile here:

I am uploaded both log files. One for the run that was complete [09_19_10.txt] and one for the run that’s happening now (incomplete) [05–09_39_08.txt].

InVEST-natcap.invest.sdr.sdr-log-2022-10-05–09_19_10.txt (321.7 KB)

InVEST-natcap.invest.sdr.sdr-log-2022-10-05–09_39_08.txt (33.3 KB)

Thank you,
Julia

1 Like

Hi Julia -

I pretty much always fill sinks in DEMs before using them in the freshwater models, and have never had this particular problem. Would you mind sending the data you’re using, including both of the DEMs that you’ve tried? You can post a link here or send it to swolny@stanford.edu.

~ Stacie

1 Like

Hello Stacie. Thank you for your reply.
I will be sending them to you by email because I can’t make this data publicly available.

Hi Julia -

Thanks for sending your data. When I bring the filled DEM into ArcGIS it appears to have a minimum value of 6e-317, which is strange (especially since this does not happen in QGIS). But then when I calculate statistics and symbolize it, the minimum value changes to 0 (just like it shows in QGIS), which is very different than the minimum of 180m in the unfilled DEM. So it’s a little confusing why there’s so much difference between the two minimum values - how did you do the Fill operation?

I’m also a bit concerned about the difference between the filled and unfilled DEM values - here’s a map of the difference, and you can see a very distinct striped pattern to it, which is suspect.

How did you resample the unfilled DEM to this coordinate system? Did you use the interpolation method of Bilinear or Cubic? If you used Nearest Neighbor, it often creates odd checkerboard patterns, so it’s better to use Bilinear or Cubic. If this isn’t the case, I’m a little concerned about the quality of the original DEM data.

Another thing that’s unusual is that your pixel size is not square in any of your inputs, including the original DEMs. This gets resampled by the model to a square cell size of 27.1m, which you can see in the output rasters. I wanted to try using the QGIS Wang & Liu Fill tool (which generally works well and we recommend) on the unfilled DEM, which also resampled the pixels to be square, and produced a filled elevation range of 188m - 911m, which seems more in line with what I’d expect (as different than a new minimum value of 0, as is in your filled DEM).

Still, if I look at the difference between the Wang & Liu filled DEM and unfilled DEM, it has that striped pattern, at least in what I’m guessing are the more flat lands:

And, it’s dramatically changing the hydrology patterns from the original DEM, which I’ve not seen happen before with this tool.

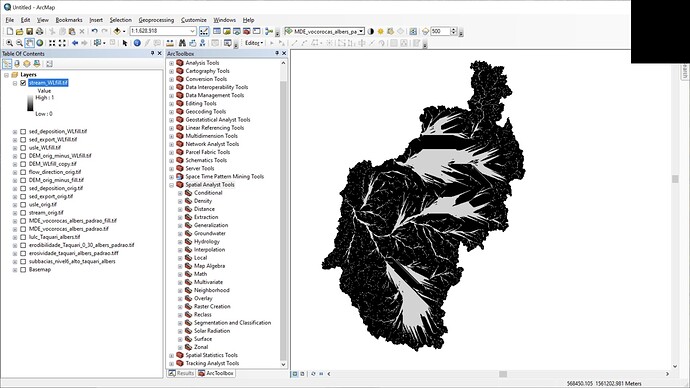
When I use this filled DEM with square pixels in SDR, it runs in about the same time as your original unfilled DEM (actually a few minutes faster). However, the defined streams are pretty bad, and take up a lot of the watershed:

Is this area very flat? Flat areas can produce this kind of stream pattern in SDR. It’s definitely hard to get good drainage patterns in very flat places, I just went through this in a large wetland in Bolivia, where I had to try 3 different DEMs to get one that worked well enough.

So I’m not sure what to say. Personally, I’d go back to the original DEM, evaluate it closely to make sure it doesn’t have any odd striped artifacts to begin with, then check how you resampled it, including the interpolation method and resampling to a square pixel size. You might want to try a different DEM too to see if that changes anything.

~ Stacie

2 Likes

Dear Stacy,
Thank you very much for the help. Actually, one of my coworkers changed the original DEM to include gullies. I do not know exactly how he did it. After this, another coworker filled the sinks. I think that is probably the problem. I will retry the analysis using the original DEM dataset and will report back to you. The cell size of 27.1m is strange, since the data I used to project all others should have 30m. I will take a look at this also.
Thank you very much.

Julia

Ah, that explains a lot! Are the gullies from agriculture, or something else? The SDR model actually has a separate optional input called Drainages, which might be useful in this case. You could keep the gullies separate from the DEM, and use them as the Drainages input. The model will treat them like the stream network, routing sediment until it hits either a stream or a gully. You can read more about this in the User Guide.

Let us know how it goes.

~ Stacie

1 Like

Yes I saw that. Yes, the gullies are from agriculture but it seems that they are old and even have relatively tall trees or bushes growing inside them. I have to think if that actually makes sense to use it as a drainage. Would it mean that the drainage areas export more sediment than others? Because that’s what we wanted to incorporate in the DEM.

Another and last question: does invest still have problems with NoData values? NaN, -9999 etc? Should I export all NA as -9999 or another value, or setting it to NA works fine? I remember reading something about a bug fix for this new version but I want to check it anyway.

Thank you again very much

SDR doesn’t include erosion happening within streams/drainages themselves, if that’s what you’re asking about, it only traces overland erosion. Since the overland erosion will be considered export once it hits a stream or gully, having gullies added to the landscape will usually mean that erosion will become export sooner, since it’s likely to encounter either a stream or gully more quickly. The USLE result should stay the same per pixel, but the sed_export and related results will often be different, likely higher, with drainages.

I’m actually not sure if NoData issues have been totally resolved, but in general I find it safest to assign NoData values no matter what I’m doing. The NoData value can be any number that is not being used for actual valid data, but it should explicitly be set.

~ Stacie

Hey Stacie and Julia,

I’ll just jump in and note that all InVEST models should handle all valid NoData types including NaN. In most cases we would consider it a bug in InVEST if a GDAL supported NoData value isn’t properly handled. Having said that, explicitly setting the NoData value to something that makes sense for the data seems like a good practice to me!

Best,

Doug

Hello,
I am having the same problem with RouteDEM running for so long ( it is almost a day that it is still calculating the fill pits) and I am wondering if the problem is caused by the very large size of the Fill_DEM raster image since its resolution is 1 (all other raster images for invest models I am going to run are in the same resolution of 1) … if it is due to that is it correct if I clip the Fill_DEM before running the RouteDEM?

Thank you,
Malihe.

Welcome to the forum @Malihe.Moradi!

1 meter resolution certainly is small. What is the total size of the DEM? If the resolution is so small, and it covers a large area, it will take a long time.

If the DEM covers a much larger area than you are using in your analysis, then yes, it’s a good idea to clip it to the analysis area (with a small buffer to make sure that the edges of the study area are completely filled in).

~Stacie

2 Likes

Thank you so much for your reply,
yes, it was so big about 60g, the reason was, as I remember in the tutorials, you mentioned that all the raster images should be in the same resolutions which is why I tried with that resolution, but in the end, the stream mask was so strange for that resolution. so I did it based on the 30m resolution with TFA 2000 and now it seems much better.

60GB is huge!

The SDR model will resample all of the input rasters to be the same resolution as the DEM. Usually, we use the DEM at its original resolution, since changing it can affect the hydrology (although often it’s not different enough to be a problem). If the original resolution of the DEM is 30m, I’d stick with that. Which input(s) are 1m resolution?

~ Stacie

the LULC is 1m,
actually, now I am having another issue regarding the watershed, the area I am working on is the metropolitan area of Prague and I want to limit all the analysis to that area, but the watershed produced in DelineateIt is much larger than my area since DEM was in two tiles and i didn’t clip it before I still didn’t run the model but if instead of watershed I use the shapefile of city border as for area of interest in urban flood mitigation model it will work as well?

Hi @Malihe.Moradi , if you have a question about the Urban Flood Mitigation Model please start a “New Topic” and ask the question there. We like to keep threads focused on the topic that is described in their title so that other readers can more easily find the answers they are looking for. Thank you,

1 Like

This topic was automatically closed 7 days after the last reply. New replies are no longer allowed.