Hello,
I ran the Seasonal Water Yield model for the first time this week and need help improving the results and calibrating my parameters. At first glance, my results seem strange to me so I want to validate I used the right parameters.
See below screenshots of the outputs of annual quickflow, baseflow (B) values and available water (L). As mentioned my results are really different from the maps shown in your introduction video. I was wondering if there is anything I can do to improve my outputs.
Available Water (L)

Annual Quickflow

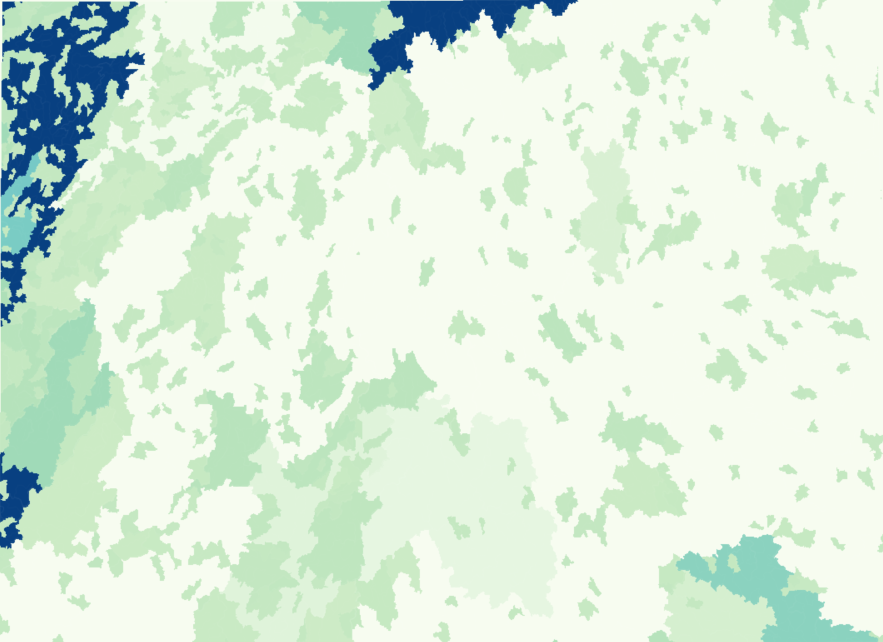
Baseflow (B)

My first thought is that it might be related to the resolution of my data. It is mentioned in the user guide that the resolution of the output rasters will be the same as the resolution of the DEM that is provided as input. Does your geoprocessing resample the resolution of data that is not the same as our DEM? For example, my DEM is at 20 m resolution while my precipitation data is at 10 km resolution. Should I resample my precipitation data first?
Otherwise, for non-spatial parameters, I used the recommended default values: Threshold Flow Accumulation = 1000, Alpha_m = 1/12 , Beta_i = 1 and Gamma = 1. I’m thinking this could be where the issue lies as well.
Any additional help or guidance would be greatly appreciated.
I am open to sending you my input data if needed but it is quite large (9 GB in total).
Thanks
InVEST-natcap.invest.seasonal_water_yield.seasonal_water_yield-log-2024-10-22–23_42_49.txt (580.3 KB)