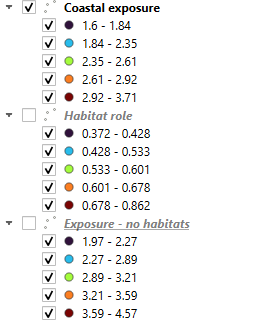
I am attaching an image of what my classes and values look like. Should i bin them from 1-5 or would that change what they mean, especially for Habitat_role, where in a previous post i was provided with the answer “habitat_role - the difference between exposure_no_habitats and exposure. Larger values indicate a larger role of habitat, relative to the other factors, in protecting that part of the coastline” [Coastal Vulnerability - habitat_role 0 values]. I am going to assume “larger value” also means “value closest to 5”.
If i did bin these, the habitat role values from 0.372 - 0.862 would not be able to go under 1. Then i wont have any points displayed on the map. How should i go about this. [Should i make a bin 0-1, then 1-2, 2-3 etc. Would that be incorrect]
The reason i want to do this is because i want to include this in a report and i want the legend to hold the same bins so its consistent and easier for the reader to compare maps.
I consulted with one of our analysts who has used this model extensively, and here’s what she said, which is consistent with my more limited experience:
Typically we bin the exposure index by quartiles and will consider the upper 25% of the coastal exposure index to be the highest risk quantile, the middle 50% to be intermediate, and the lowest 25% to be lowest risk. This is the approach we’ve taken in papers we’ve published about the CV model, but it is by no means the only way to visualize and conceptualize the results. If there are empirical data for your area about exposure to coastal floods and erosion it might make sense to see how the exposure index maps out against those to help inform where to make the high risk cutoff.
The habitat role output is the difference between the coastal exposure index with habitats included in the model and without habitats. The “without habitat” scenario is run automatically by the model as a counterfactual. So, the ‘habitat role’ metric quantifies the role of habitats (taken together) in mitigating coastal risk at a specific location. The higher the value the greater the habitat role. Sometimes habitat role is symbolized as a graduated color ramp but not categorized and sometimes it is categorized into quartiles similar to the coastal exposure index.