As far as the RouteDEM process goes, it will struggle on that ASTER DEM given that it is covering multiple islands. It doesn’t know that there are oceans between those elevations so I suspect that pit filling algorithm is trying to route like this was all one connected land mass. I believe the thing to do here in general is to break the project up by land mass. You would want to mask your ASTER DEM with land mass shapefiles and run those individual masked DEMS through RouteDEM. @jdouglass can correct me if I’m mistaken.
Interesting, @dcdenu4. RouteDEM didn’t show this stuck behavior with the SRTM DEM, so I wonder how the ASTER one is different? @ndmetherall, is there a difference in how the area in between islands is represented by these two DEMs? There are a lot of islands, and it might be a huge pain to do each one individually, so I’m hoping that doesn’t need to happen.
Also do you know how to download large sections of Soil GRIDS from ISRIC at once or do I have to just do it for each component of K one 250m square at a time? SoilGrids — global gridded soil information | ISRIC
Just an update here. I’m also experiencing the hang up with this DEM raster. I haven’t had time to look into it too deeply yet, but will keep you posted.
I always clip my SDR inputs to my watersheds (or island in your case). Or more specifically, I’d clip them to the island + a small buffer, to make sure that any coarse datasets completely cover the study area. Then you have NoDatas everywhere outside of the study area.
Regarding easier ways of getting SoilGrids data, I mentioned this a while back:
Ah thank you @swolny - I am revisiting this now from your earlier messages above.
Following your advice, I have managed to find the instructions about using WCS through QGIS here: Instruction WMS | ISRIC and have found the following options:
’
And these were some datasets for clay for example - I have tried to use the 0-5 cm mean % compositions for each of the inputs for erodibility (i.e. clay, silt, sand and SOC):
However, when I try to add these to my QGIS geodatasets I tend to get an error where the datasets don’t visualise properly and I cannot change the symbologies. It also seems difficult to get everything on the same CRS even though I have changed every CRS to the same UTM CRMS - (UTM Zone 57S). It looks like a black box for each of the different datasets:
I also had issues trying to bring in my landcover raster. However, it would also not visualise in the same UTM Zone 57S. So I have to use the geoference tool in QGIS to overlay it over the map. I have shown this on the right:
Will this output still work in the SDR model? Or do I need to redo this?
I have also retried the DEM based on the advice of @swolny and @dcdenu4 - I have used the Solomon’s Island DEM for just one island and tried to generate streams using the Strahler stream order in QGIS but it did not work. However, RouteDEM did seem to work better:
However, as shown here the Lungga River is at least partially showing up. Better than previous iterations. However, the pour point / outlet point is still incorrect as shown by the yellow line and pink square where it should be and the white river which is generated by RouteDEM instead.
In QGIS it looks like you’re using the WMS service, not WCS, but you need to use WCS in order to save the data so you can reproject and otherwise work with it in the GIS.
I’m not sure what’s going on with the landcover raster in QGIS, you shouldn’t need to do anything to it for it to work there, although it’s more of a pain for symbology. You don’t need to get all of your other layers working in QGIS, you can just extract the soil layers with WCS, then bring the extracted layers into ArcGIS and keep working with that as you did before.
If the streams that the model makes are good enough for you, then technically it’s fine for the model. It’s really annoying when the stream network is hard to create properly, happens to me all the time. You’ll just need to weigh whether the outlet of the Lungga (and potentially any others) not coming out at the right place is an issue for your analysis, audience, etc. If it is not, then you can just add that to the list of caveats and uncertainties. If it is an issue for your analysis or audience, then it may be worthwhile to try other DEMs or methods of forcing that river to exit in the right place.
Thanks for the information @swolny - I am having some trouble downloading via WCS.
I was trying the WMS instructions here originally Instruction WMS | ISRIC but as you have mentioned, I should use WCS in order to be able to reproject.
I haven’t used Python code to do this, I’ve just gone through the user interface, using something like Layer → Add Layer → Add WCS Layer. Then go to New, fill in the URL (it seems that the WMS URLs work fine), Connect, and select a soil layer to add to the map. Then you can Export it to save to a TIFF (choosing to save just the local map “canvas” extent, or the whole global layer), then proceed with working with that saved raster locally.
Ok great thank you. I have managed to follow your advice and import and clip from WCS as advised. Then I have been doing the raster calculator steps and multiplying the final results by 0.1317.
I get the following output raster value ranges with K not visualising a result.
Here are some images of the intermediate outputs which are visualising :
Fcsand (this seems to give a an upper range for land being much too high in magnitude) sea values no data should be 0.
What units are the f* layers supposed to have? All the same units? fcl_si looks like an outlier.
It’s definitely a problem having raster values of 3.40282e+38, and K doesn’t seem to have valid values at all, so I’d look at where exactly those are happening and see if there’s a divide by 0 or something causing it. For an example of the typical values in a K raster, check out the sample data for SDR, which you might have installed when you installed InVEST, or you can download separately here.
Fair enough. Thanks @swolny. Good points. I have revisited the gura files and found K values should be between 0 and 1 consistent to the literature values for K.
I am trying to find the root cause of these errors. I am testing a range of different assumptions. Seeking to confirm the following with you:
I note that all of the raster layers for sand, silt, clay have values in the magnitude range of 0 to 10E1 except for SOC which ranges from 0 to 10E2
Note, I am sourcing from the mean soil layers for 0 - 5 cm - please let me know if you recommend a different layer
I am using the equations below.
I note, that each of the inputs should be a % content. However, I am not sure how to work out the % contents for each input. Should I be dividing the content by the total of all the different compositions… i.e. (515 + 375 + 408) = 1298. So should I be rewriting all the formulae like this example:
BEFORE ) Fcl-si = msilt / (mclay + msilt)^0.3
AFTER ) Fcl-si = (msilt/1298) / (mclay/1298) + (msilt/1298))^0.3
Sorry @swolny - I misunderstood your question above. I get it now.
So the desired unit measurements are % of content.
The unit measurements I seem to be getting for the mean composition layer from WCS must not be % of content since they are in the magnitudes of 100s (for clay, silt, sand) and 1000s (for SOC).
I think I have found the solution based on your questions but it would be good to confirm with you:
For SOC to get from the soilgrids unit measurement of dg/kg to % I think I would need to divide by a factor of 4 to give a range of 0-16% which makes sense.
For the other unit measurements it would involve a factor of g/kg > dividing by a magnitude of 1000 to get to percentage.
Dear @swolny - in a semi-breakthrough, I have managed to get something closer to the mark.
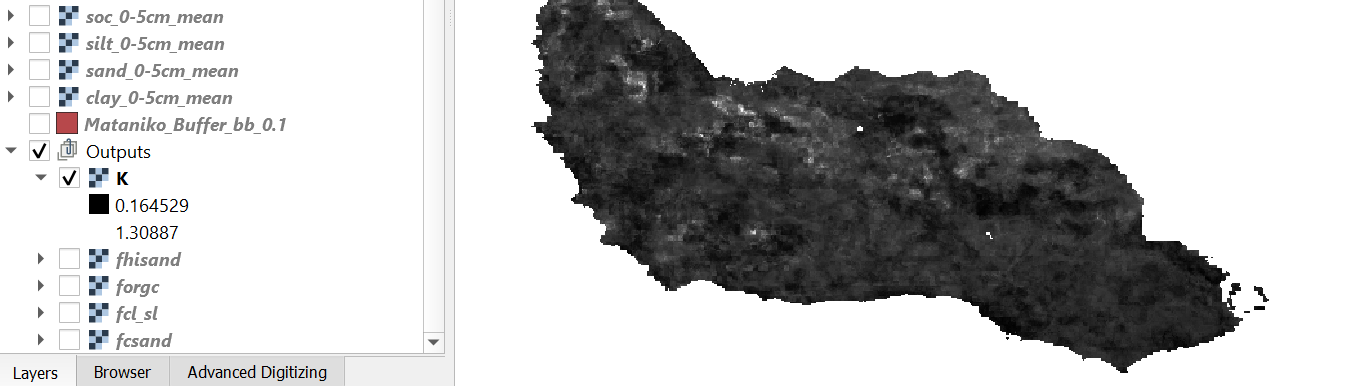
By dividing each of the inputs by the upper limit of the raster range I got to a % composition. I then ran all the georaster calculations for K (multiplying by 0.1317 at the end) to get the following:
However, the range is 0.16 to 1.3 (I believe the range of K values should only go up to a maximum of 1) correct? So while, close, I am still slightly missing the mark?
Search results show no returns for “error”. However, there must be some sort of issue with the inputs to be getting such output raster ranges from the model.
My biophysical table compared to the Gura example:
My biophyscial table has fewer fields than the example - is this ok?