I’m running the Seasonal Water Yield (SWY) model (InVEST version 3.16.0), and I’m encountering a persistent issue with the LULC classes and biophysical table lookup.
My biophysical table contains corresponding lucode values for all of these classes.
I checked the raster pixel types — they are int32.
To be extra cautious, I also:
Added a dummy 2 class to the biophysical table because I suspected a float/int mismatch issue (KeyError: 2.0).
Converted the biophysical table lucode column to float so that the data types align.
Error Message:
Despite these steps, InVEST throws the same exception every time:
makefile
CopyEdit
KeyError: 2.0
That is:
makefile
CopyEdit
KeyError: 2.0

Traceback:
  ...
  pandas\core\indexes\base.py in get_loc
  ...
What I have tried so far:
Ensured LULC contains no 2s Added dummy lucode=2 to the biophysical CSV Converted biophysical lucode column to float Converted LULC to int32 Checked that NoData is properly set in the LULC
And still the issue persists.
Request:
Why does the model look for class 2.0 when it doesn’t exist in my raster or table?
Could this be an internal bug where the model incorrectly infers a 2 class?
Is there a recommended workflow for ensuring datatype compatibility (int vs float) between LULC and the biophysical table?
Your guidance would be greatly appreciated — this issue is blocking my SWY analysis entirely. Thanks in advance!
Thanks for all of that information about what you’ve tried. We also ask that you post the entire log file (ends in .txt) that the model creates in your Workspace. Thanks again.
Thanks for the logfile @abir. It does not contain a KeyError, but does show errors related to file access. These might be caused by one of the input files being open in another program (like an editor, or backup app). Or perhaps the input files and/or Workspace is on a network drive? Sometimes that can cause problems.
I have uploaded all the required files, including the TXT file for the LULC biophysical table. Could you please help me check and resolve the error I’m facing? Thank you in advance for your support!
Based on this log file and what’s happening in the code at this point, I think the issue may actually be with your Rain Events Table CSV, not with your LULC classes or biophysical table. It looks like the model can’t find a row in the Rain Events Table CSV for month 2. Can you double check your table? Per the User’s Guide, this table should have columns named month and events, where month values “are the numbers 1-12 corresponding to each month, January (1) through December (12).” Feel free to also upload that CSV if you’d like another set of eyes on it!
now I’m having problem as you can see in this picture why the map of base flow is not aligned with shapefile where quick flow is aligned and why this kind of values?
It’s difficult to say what may be going on just based on a screenshot. If you can share a link to your input data, I’d be happy to run the model and take a look at the results.
Thank you for the support. I reviewed the logs and found that the error occurred due to misaligned spatial references among the input rasters.
I realized that some of the inputs were in geographic coordinates (EPSG:4326) while others were in projected UTM (meters). I’ve now reprojected all rasters to a common projected CRS (EPSG:32644), ensuring they overlap spatially.
Additionally, for model parameters:
I’m using a threshold flow accumulation value of 1000 to define streams. This seemed appropriate for my basin size (~143,219 km²), but I’m open to suggestions if a more suitable value is recommended.
The alpha parameter is set to 1/12, and beta and gamma are both set to 1, as per the default configuration.
Please let me know if you have any recommendations for tuning these values or further optimizing model performance. Thanks again!
I’ve requested access to the folder you sent. I’m still happy to run the model to validate that your inputs are producing error-free outputs, but it sounds like you’ve already solved your problems with misalignment! Unfortunately I’m not an expert in this model’s science, so I don’t have any insight in terms of value-tuning; I’d recommend going with whatever values make sense based upon your research.
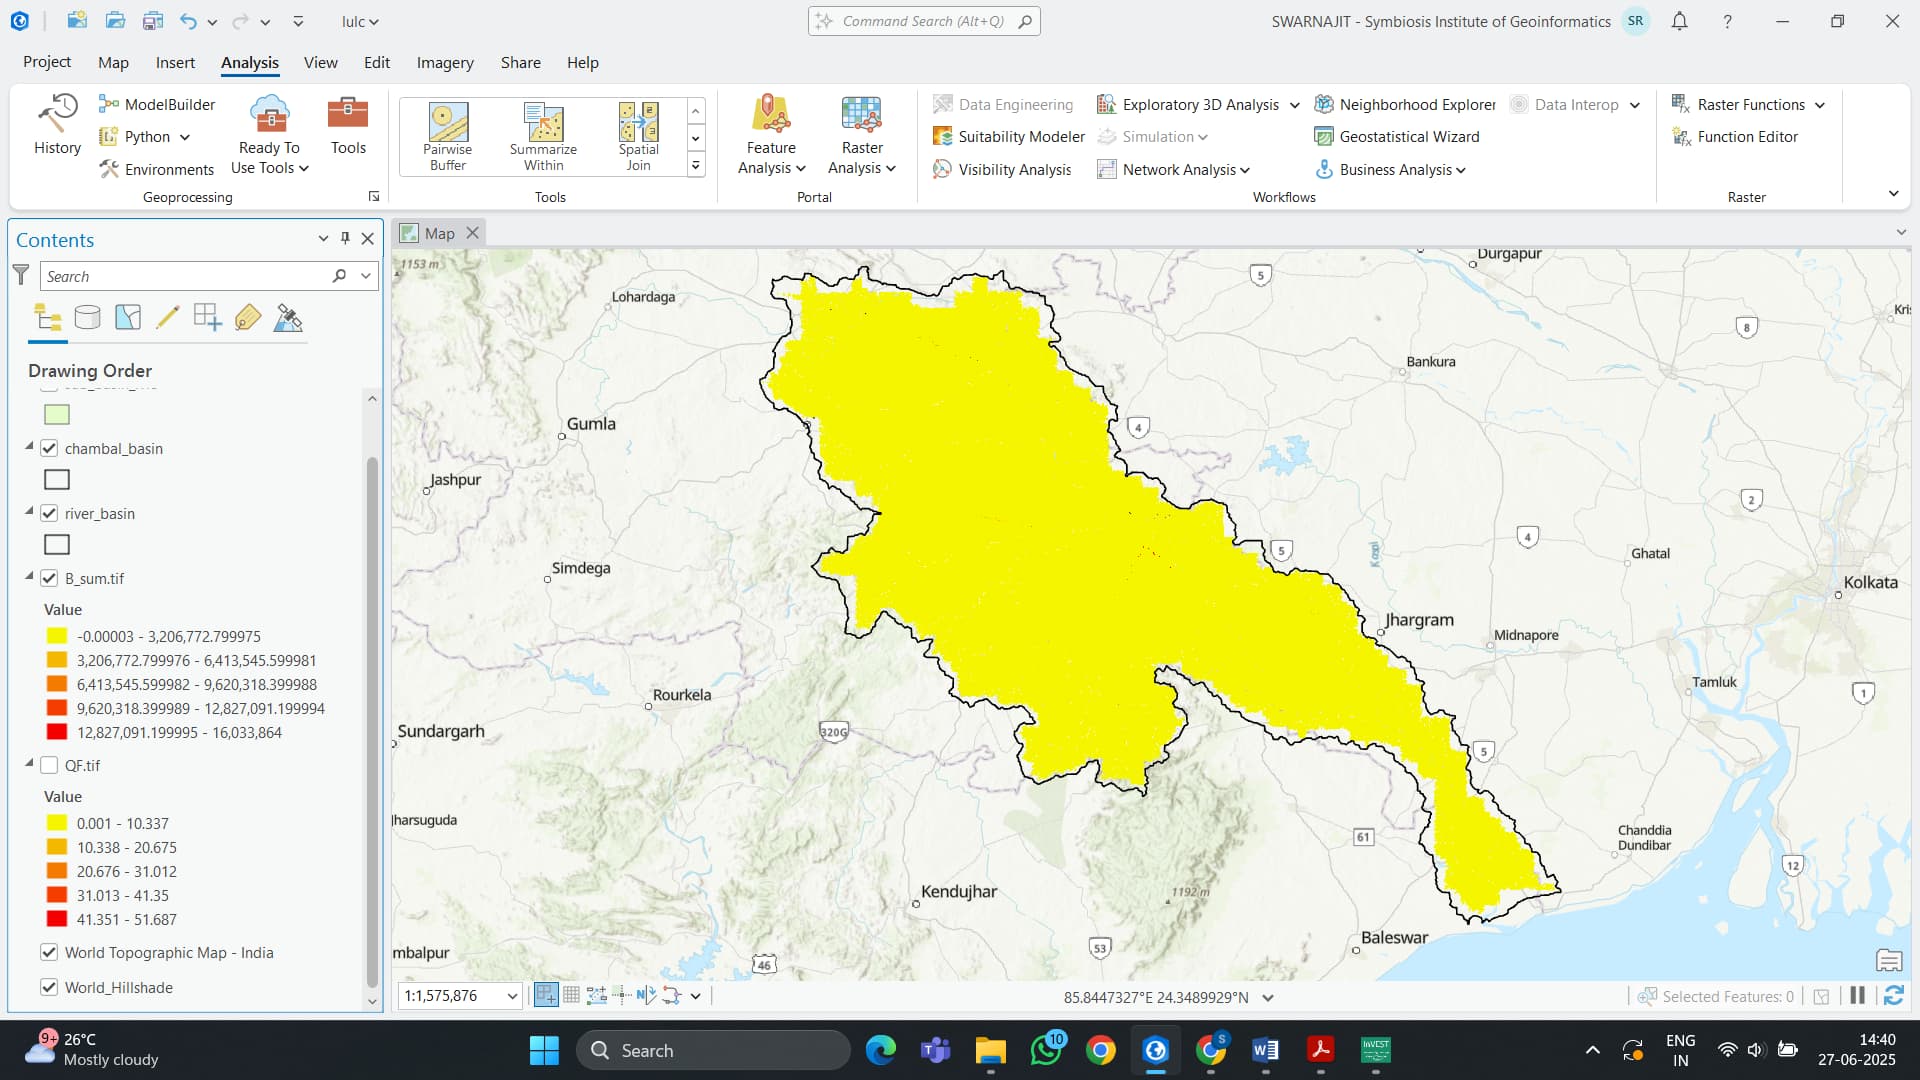
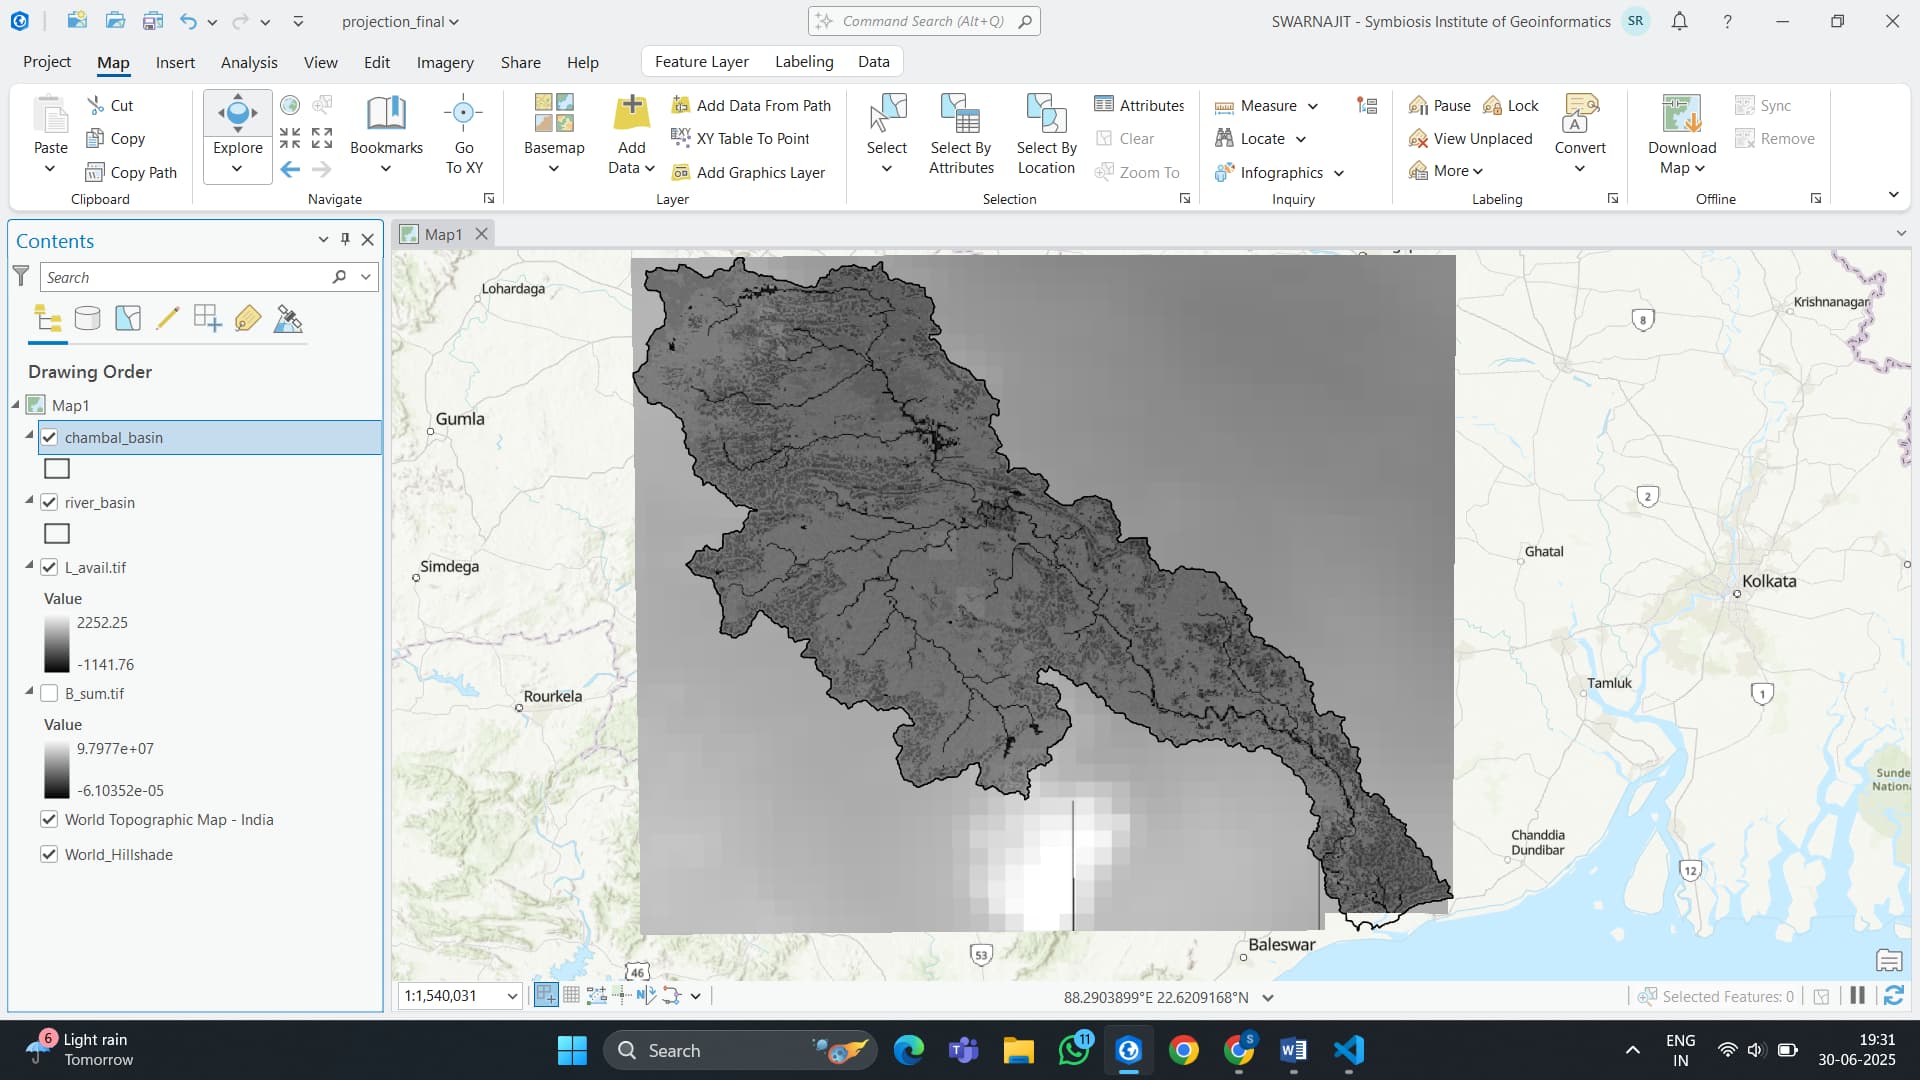
i have solved my issue right now i am in trouble to interpret my result of base flow and if you see in the bottom left corner their is a gap in the map
I do see the gap in the map. If you either make that Drive folder public or share it with me (mnissel@stanford.edu), I can take a look at your inputs to see if I can help you figure out where that gap is coming from.
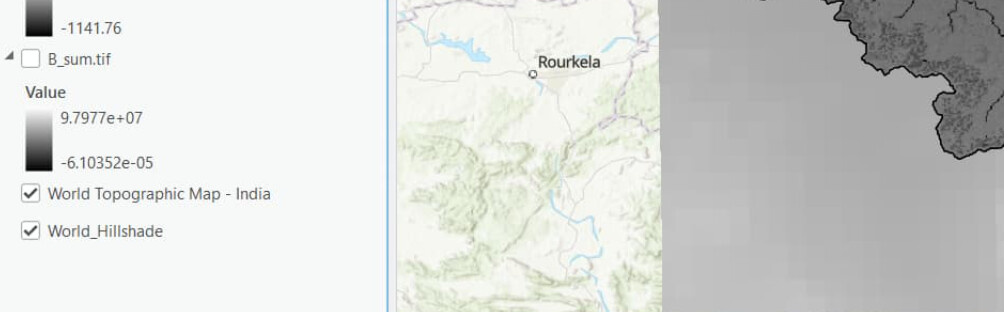
I was able to run the model using your data and I’m also seeing that gap in the output rasters. It looks like it’s likely a result of a NoData section in your ET0 rasters that overlaps with your AOI, as you can see in this screenshot:
The model won’t be able to calculate results in places where there’s missing input data to use in those calculations. In order to get results covering your entire AOI, you would therefore need to provide ET0 rasters that include values for all of the pixels overlapping your AOI. If ET0 data for the currently-missing area doesn’t exist, or cannot be found, that may represent a limitation in your analysis.
As for the large values you’re seeing in B_sum.tif, as the User Guide says, this raster represents “the flow through a pixel, contributed by all upslope pixels, that is not evapotranspired before it reaches the stream.” So it’s very possible for this to be a large number, if there is a lot of precipitation, and/or a large upslope contributing area, and/or low evapotranspiration. You can see similarly large values in the B_sum.tif raster produced by running the model against our sample data.
I’m happy to inform you that I have successfully resolved all the issues I was facing—many thanks to your team for the support. The model outputs are excellent and align well with my expectations.
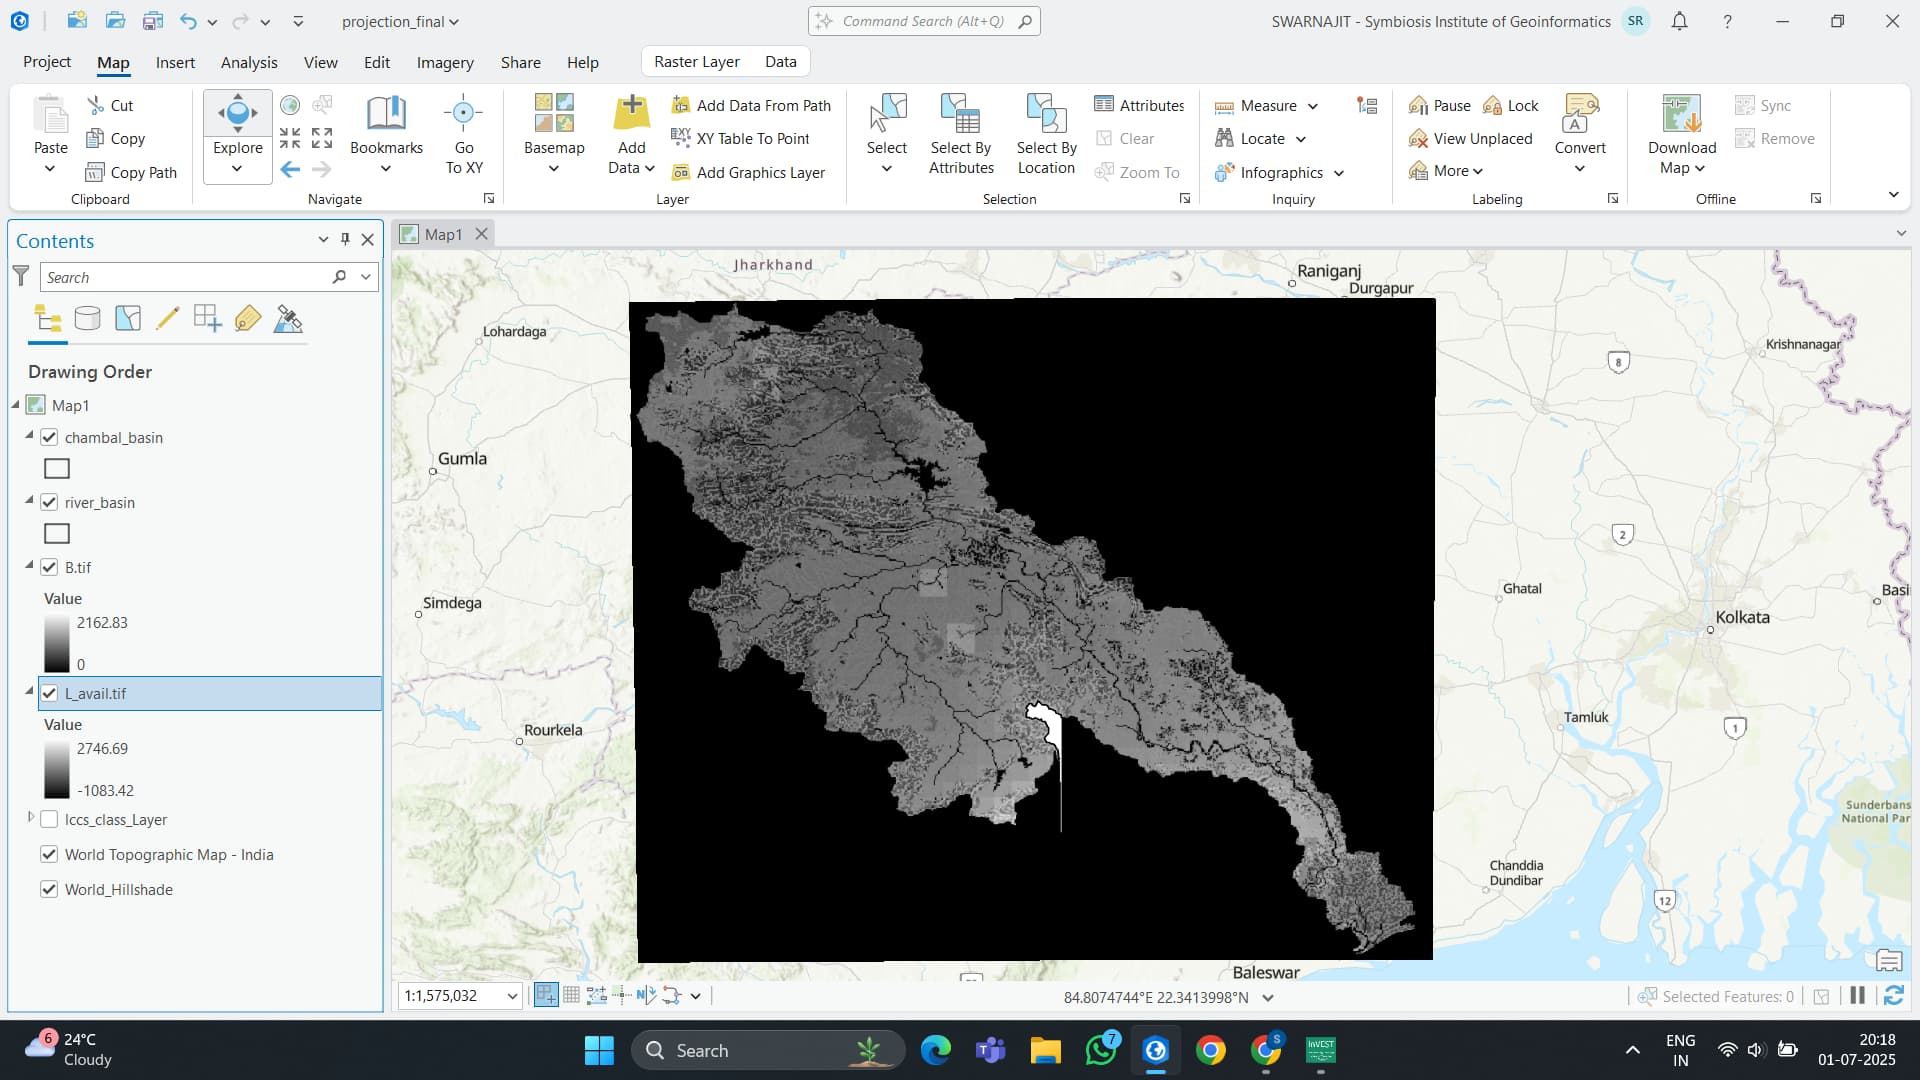
However, I noticed that some of the raster outputs contain negative starting values, as shown in the attached image. I would like to understand how to interpret these negative values. Are they indicative of an error, or are they a normal part of the model’s calculation?
I’m glad to hear you’ve successfully resolved your issues with alignment!
There are several model results that can indeed be negative. Per the User’s Guide section on Local Recharge: “Local recharge can be negative if a pixel does not receive enough of its own water to satisfy its vegetation requirements (determined by its crop factor Kc), so it uses water generated upslope of the pixel as well (referred to as an “upslope subsidy”.)” The raster in your screenshot, L_avail, is the “Map of available local recharge L_avail.” And L_avail, according to the documentation accompanying Equation 97, “is the available recharge to a pixel, which is L_i whenever L_i is negative, and a proportion γ of L_i when it is positive.”
So, to summarize, the local recharge of a pixel (L_i) can be negative and, if it is, L_avail will also be negative.
It is also worth noting that the values in the L_avail raster should be interpreted as relative values, not absolute (see Interpreting Results in the User’s Guide).
 What I did:
 Error Message:
 What I have tried so far:
 Request: